Academic Economics Chart Simulation
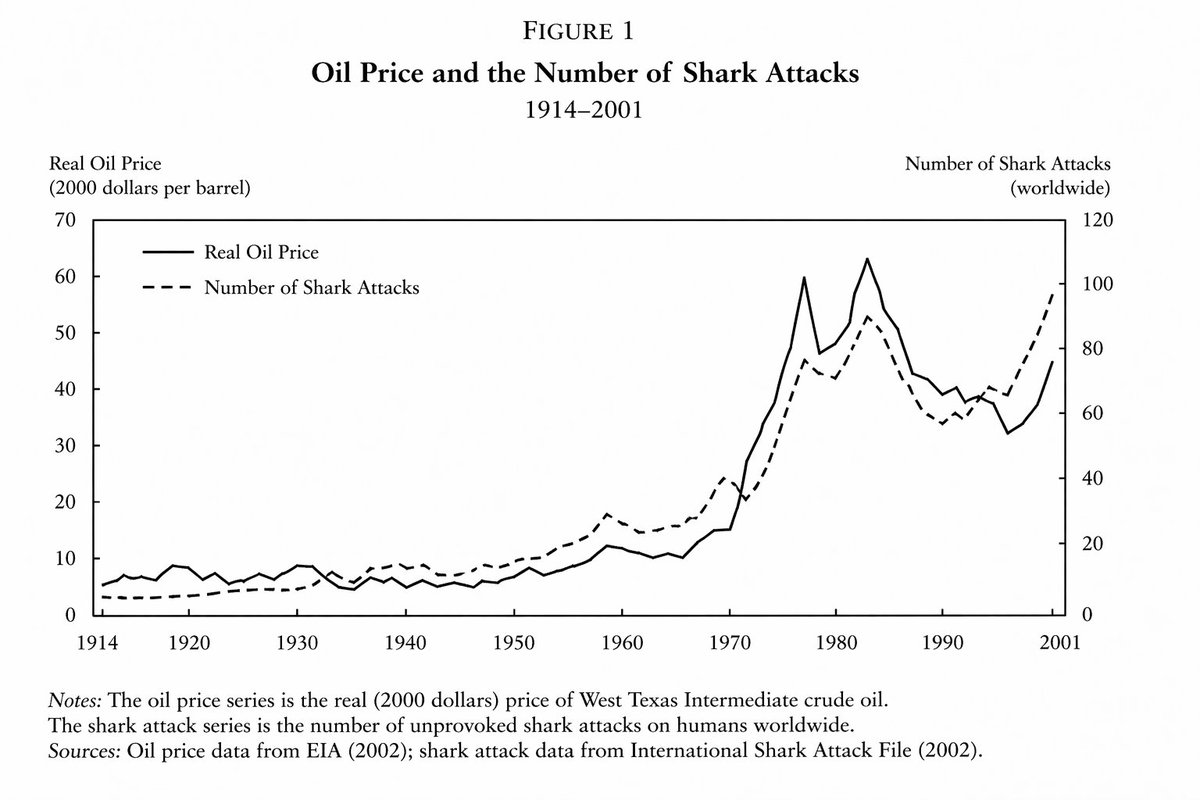
A prompt designed to generate highly realistic but fictitious academic charts, specifically showing a correlation between oil prices and shark attacks in an economics paper style.
도식, 체크리스트, 로드맵, 학습용 긴 이미지에 적합합니다. 정보 구조를 먼저 정하고 이미지 안의 글자는 짧게 유지하세요.
추천 비율
16:9 또는 4:3
품질 전략
먼저 가볍게 생성하고 좋은 안을 고해상도로 다듬기
생성 흐름
먼저 텍스트로 핵심 이미지를 만들고, 한 번에 중요한 요소 하나만 수정하세요.
전체 Qwen Image 프롬프트
English prompt
line graph from an important and prestigious {argument name="field" default="economics paper"} demonstrating a close but not exact relationship between {argument name="variable one" default="the price of oil"} and {argument name="variable two" default="the number of shark attacks"} between {argument name="time period" default="the years of 1914 and 2001"}관련 Qwen Image 프롬프트
VR Headset Exploded View Poster
Generates a high-tech exploded view diagram of a VR headset with detailed component callouts and promotional text.
Illustrated City Food Map
Generates a hand-drawn, watercolor-style tourist map featuring numbered local food specialties, landmarks, and a legend.
3D Stone Staircase Evolution Infographic
Transforms a flat evolutionary timeline into a realistic 3D stone staircase infographic with detailed organism renders and structured side panels.
Momotaro Explainer Slide in Hybrid Style
A prompt that combines the simple, warm aesthetic of simple illustration style illustrations with the high-information density characteristic of Japanese government slides.
Faceless Cyberpunk Infiltrator
Generates a cinematic anime scene of an armed faceless woman infiltrating a high-security futuristic server room.
Pancake Angel Cafe Cover
Generates a dreamy watercolor anime cover of a winged cafe angel serving honey pancakes in a sunlit morning cafe.