Academic Economics Chart Simulation
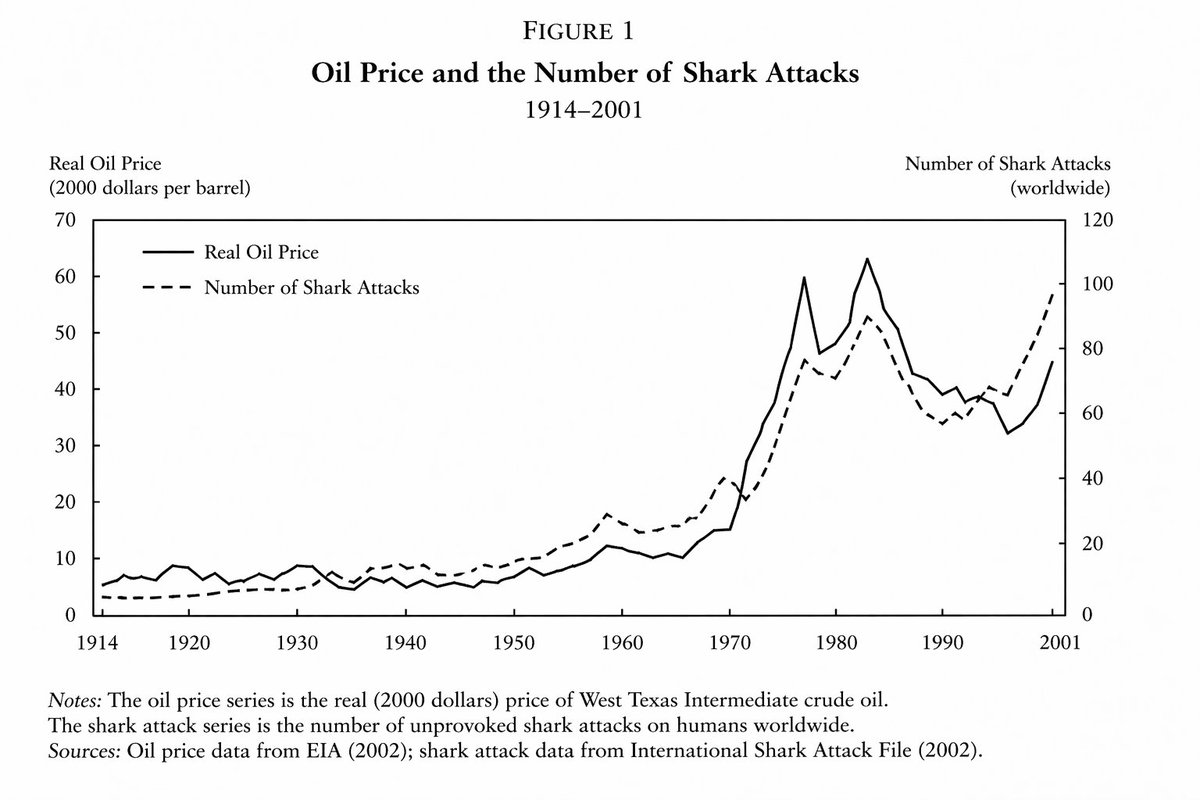
A prompt designed to generate highly realistic but fictitious academic charts, specifically showing a correlation between oil prices and shark attacks in an economics paper style.
図解、チェックリスト、ロードマップ、学習用長図に向いています。情報階層を先に決め、画像内テキストは短くすると安定します。
推奨比率
16:9 または 4:3
品質の進め方
まず軽く生成し、良い案を高精細で詰める
生成フロー
まずテキストで主画面を作り、一度に一つの重要な要素だけ修正します。
Qwen Image 完全プロンプト
English prompt
line graph from an important and prestigious {argument name="field" default="economics paper"} demonstrating a close but not exact relationship between {argument name="variable one" default="the price of oil"} and {argument name="variable two" default="the number of shark attacks"} between {argument name="time period" default="the years of 1914 and 2001"}関連するQwen Imageプロンプト
VR Headset Exploded View Poster
Generates a high-tech exploded view diagram of a VR headset with detailed component callouts and promotional text.
Illustrated City Food Map
Generates a hand-drawn, watercolor-style tourist map featuring numbered local food specialties, landmarks, and a legend.
3D Stone Staircase Evolution Infographic
Transforms a flat evolutionary timeline into a realistic 3D stone staircase infographic with detailed organism renders and structured side panels.
Momotaro Explainer Slide in Hybrid Style
A prompt that combines the simple, warm aesthetic of simple illustration style illustrations with the high-information density characteristic of Japanese government slides.
Faceless Cyberpunk Infiltrator
Generates a cinematic anime scene of an armed faceless woman infiltrating a high-security futuristic server room.
Pancake Angel Cafe Cover
Generates a dreamy watercolor anime cover of a winged cafe angel serving honey pancakes in a sunlit morning cafe.